top of page

You Call Yourself A Man?
Data Visualization, Fall 2022
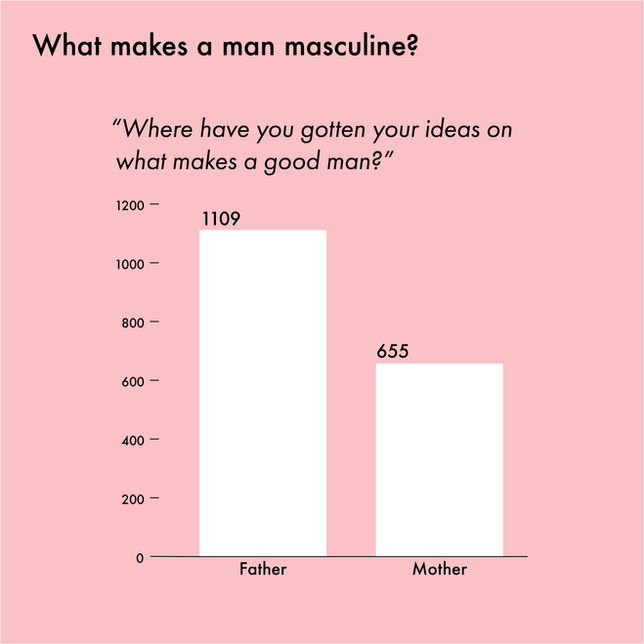
I analyzed over 1,600 survey responses from men on masculinity during #MeToo movement to create educational infographics for social media. They addressed the changing opinion on appropriate workplace behavior and the likelihood of different demographics being affected by toxic masculinity. The graphs were generated in Illustrator and then imported to a layout in Indesign.
bottom of page


